


Can You Still Afford to Buy a Home in the Bay Area? Here’s What the Data Says
#LifeInMarinWithJenn | @HomesInMarin
If you’ve been wondering whether buying a home in the Bay Area is still within reach, you’re not alone. According to newly released data from the National Association of Realtors (NAR), housing affordability across the San Francisco–Oakland–Berkeley metro is tightening — and while the challenges are real, so are the opportunities.
📊 What the Numbers Tell Us
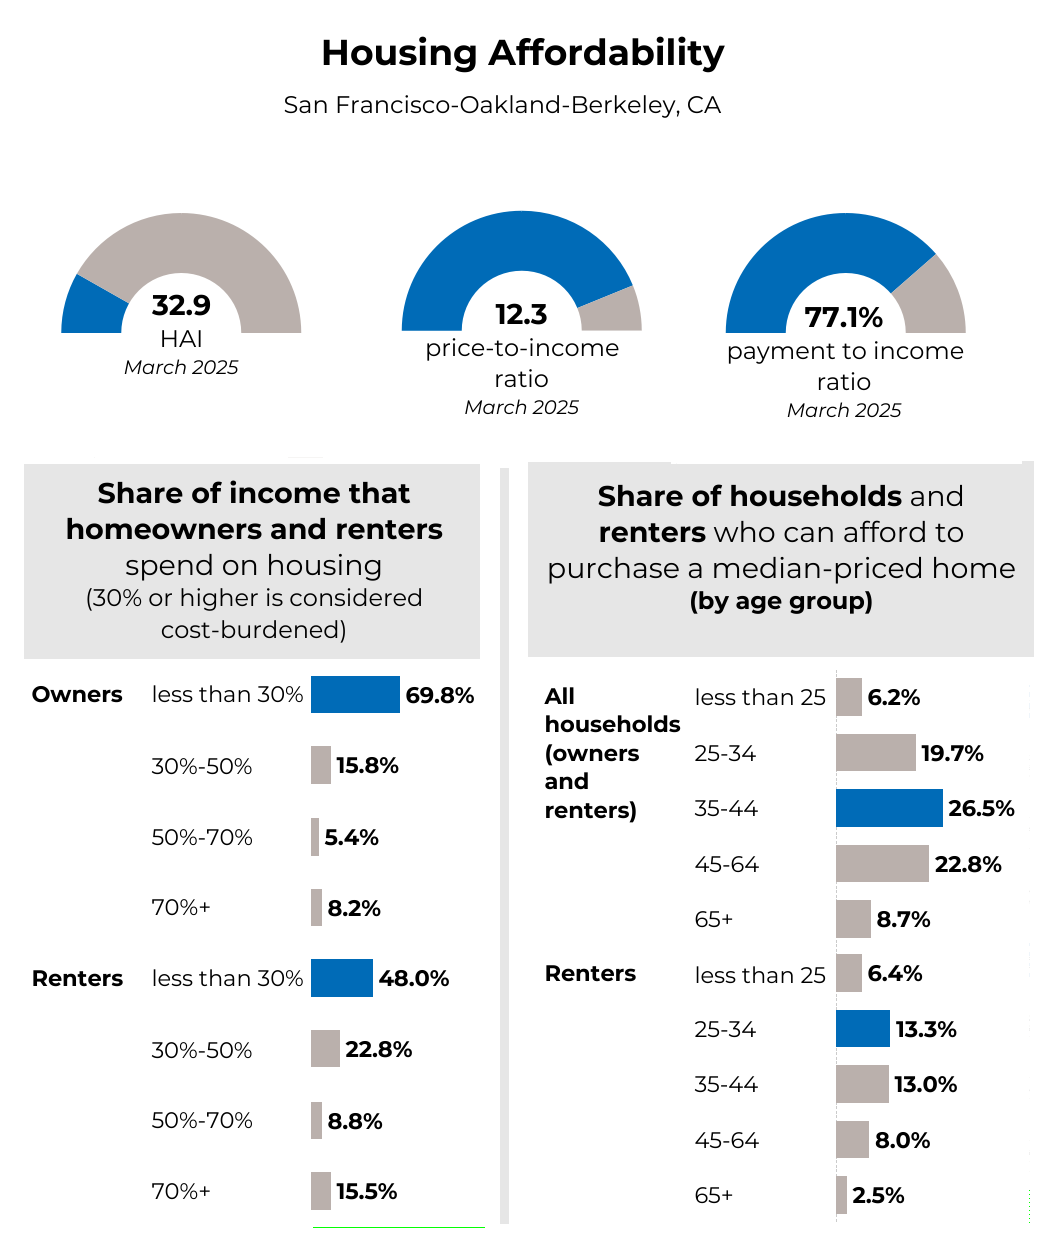
🏡 Housing Affordability Index (HAI):
At just 32.9, the Bay Area’s HAI is well below the national average — meaning fewer households can afford a median-priced home here.
💰 Price-to-Income Ratio:
Currently at 12.3, which means homes cost more than 12 times the median household income. (To compare: a balanced market typically hovers around 3–5.)
🏦 Payment-to-Income Ratio:
Bay Area buyers are spending 77.1% of their income on mortgage payments — well above the 30% guideline that defines affordability.
🔍 Renters vs. Owners: Who’s Feeling the Pinch?
Homeowners:
- 69.8% spend less than 30% of their income on housing — generally considered financially healthy.
- Only 8.2% of owners are severely cost-burdened (spending 70%+).
Renters:
- Just 48% of renters spend under 30% on housing.
- A concerning 15.5% are paying over 70% of their income just to keep a roof over their heads.
Translation? Renters are significantly more vulnerable to financial pressure, making the leap into homeownership feel further out of reach.
🧑💼 Who Can Actually Afford to Buy?
Only 26.5% of households aged 35–44 can afford a median-priced home. That drops to just 13% of renters in that same age group — and the numbers get even tighter for those under 25 or over 65.
But here’s the hopeful part: this same 35–44 age group also represents the strongest buyer demographic right now — with income, credit, and life stages aligning just enough to make homeownership viable, especially with the right guidance.
💡 What This Means for You
If you’re feeling priced out, you’re not alone — but that doesn’t mean your dream of owning in Marin or San Francisco is off the table.
The truth is:
✔️ Every buyer’s path is different
✔️ There are still smart opportunities in today’s market
✔️ A clear strategy makes all the difference
Whether you’re just starting to think about buying or you’re actively exploring neighborhoods, I’m here to help you navigate this market with confidence and clarity.
📲 Reach out anytime — let’s talk strategy, lending partners, and how to make the numbers work for you.
#LifeInMarinWithJenn | @HomesInMarin
Helping Bay Area buyers find smart, beautiful homes that fit their lives and long-term goals.
Source: National Association of Realtors (NAR), Housing Affordability and Demographic Data, March 2025.