


Current State of the Housing Market; Overview for mid-August
By: CALCULATEDRISK BY BILL MCBRIDE
On Friday, in Part 1: Current State of the Housing Market; Overview for mid-August I reviewed home inventory and sales.
House Prices
Reported YoY house price growth remained negative in May, with the Case-Shiller National Index down 0.5%.
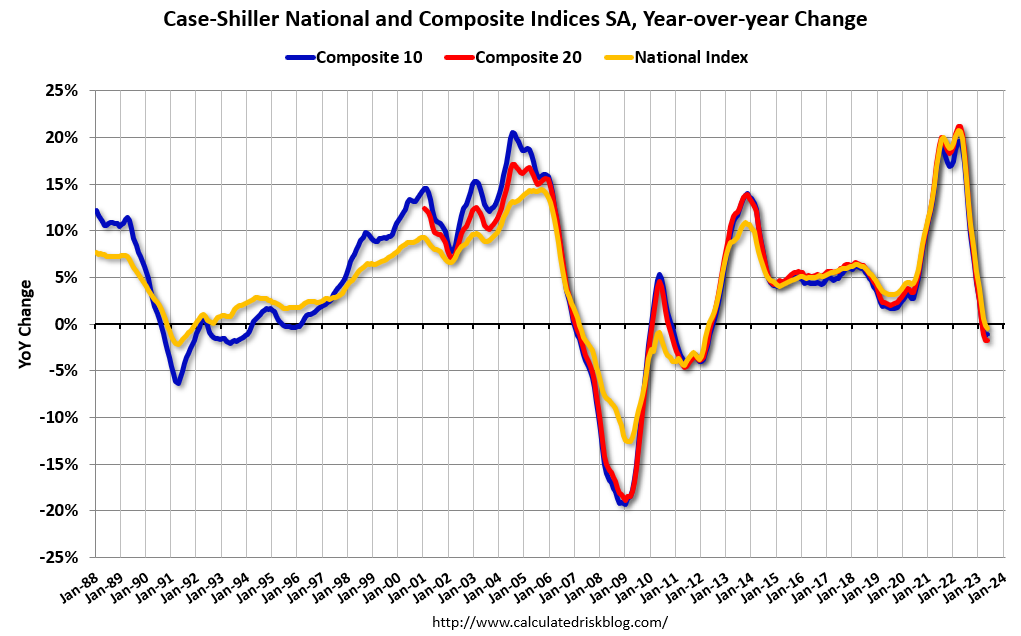
The MoM increase in the seasonally adjusted Case-Shiller National Index was at 0.74%. This was the fourth consecutive MoM increase following seven straight MoM decreases.
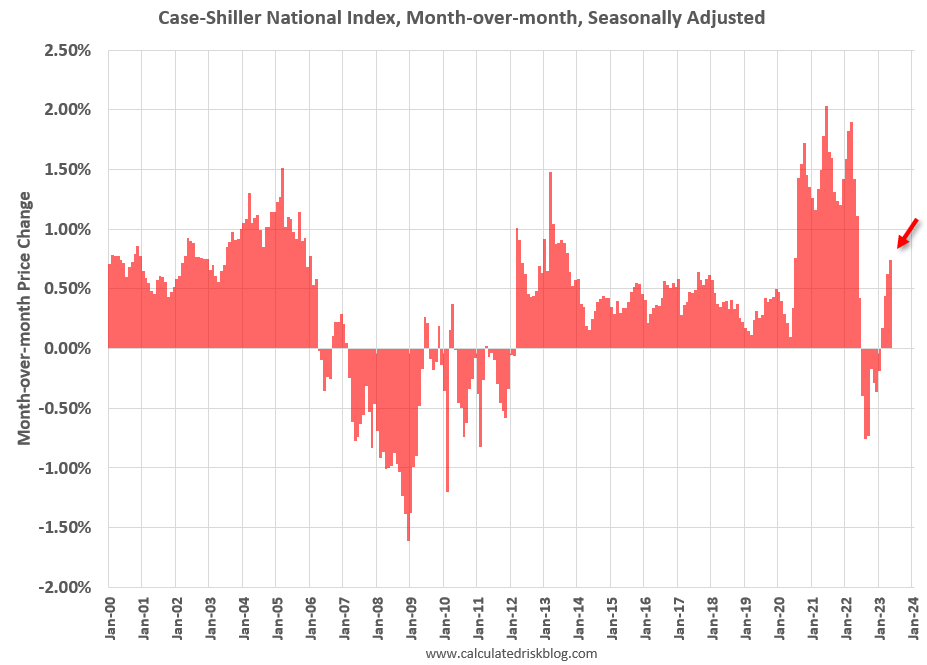
Most measures of house prices have shown an increase in prices over the last several months, and a key question is Will house prices decline further later this year?
Other measures of house prices suggest prices will be up YoY soon in the Case-Shiller index. The NAR reported median prices were down 0.9% YoY in June, smaller than the 3.0% YoY decline in May. Black Knight reported prices were up 0.8% YoY in June to new all-time highs, and Freddie Mac reported house prices were up 1.7% YoY in June, up from 0.8% in May.
Here is a comparison of year-over-year change in the FMHPI, median house prices from the NAR, and the Case-Shiller National index.
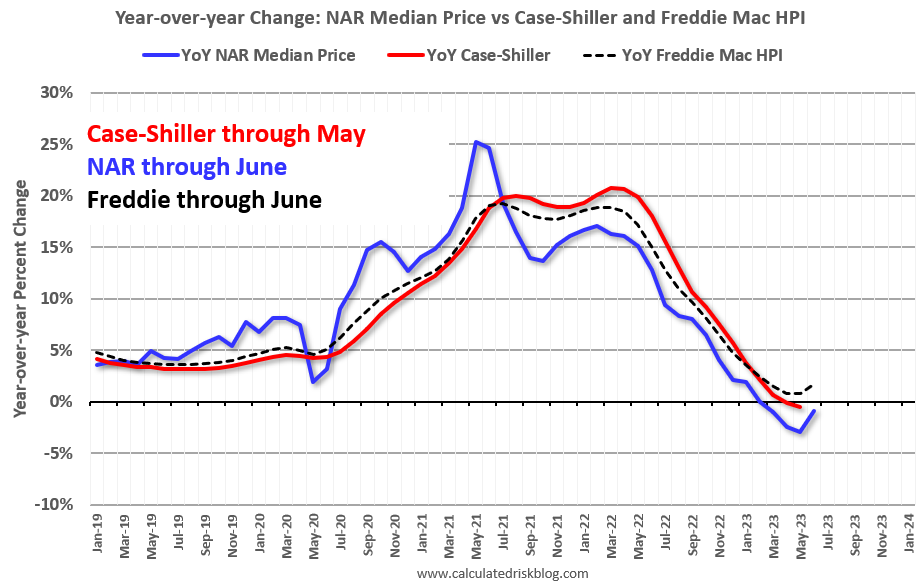
The FMHPI and the NAR median prices appear to be leading indicators for Case-Shiller. Based on recent monthly data, and the FMHPI, it seems likely the YoY change in the Case-Shiller index will turn positive this summer.
In real terms, the Case-Shiller National index is down 4.4% from the peak, seasonally adjusted. Historically it takes a number of years for real prices to return to the previous peak, see House Prices: 7 Years in Purgatory.
30-Year Mortgage Rates Have Moved Back Above 7%
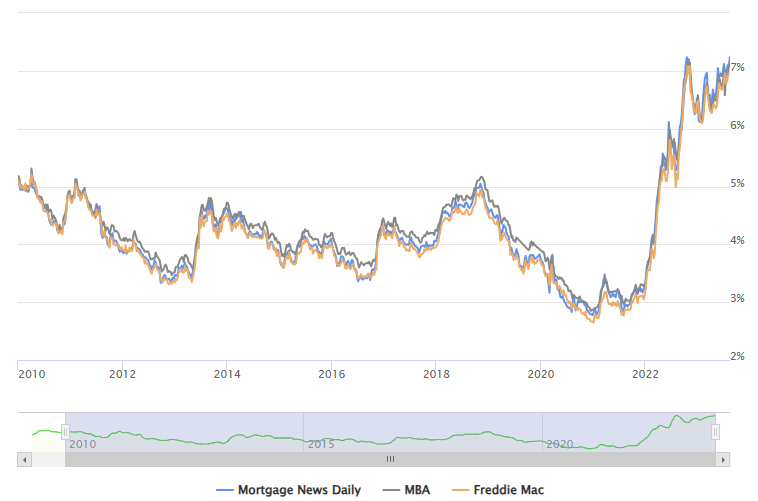
The following graph from MortgageNewsDaily.com shows mortgage rates since January 1, 2010. 30-year mortgage rates were at 7.24% on August 14th, near the recent high of 7.37% in October 2022, and up year-over-year. A year ago, 30-year mortgage rates were at 5.25%.
A year ago, the payment on a $500,000 house, with a 20% down payment and 5.25% 30-year mortgage rates, would be around $2,208 for principal and interest. The monthly payment for the same house, with house prices down 0.5% YoY and mortgage rates at 7.24%, would be $2,712 – an increase of 23%.
However, if we compare to two years ago, there is huge difference in monthly payments. In August 2021, the payment on a $500,000 house, with a 20% down payment and 2.99% 30-year mortgage rates, would be around $1,706 for principal and interest. The monthly payment for the same house, with house prices up 19.3% over two years and mortgage rates at 7.24%, would be $3,252 – an increase of 93%! Almost double!!!
This increase in mortgage rates is probably the key reason new listings have declined sharply year-over-year – especially since a large number of homeowners refinanced at lower rates in 2020, 2021 and early 2022.
See: Could 6% to 7% 30-Year Mortgage Rates be the “New Normal”?
Asking Rents Decline Year-over-year
Tracking rents is important for understanding the dynamics of the housing market. For example, the sharp increase in rents helped me deduce that there was a surge in household formation in 2021 (See from September 2021: Household Formation Drives Housing Demand). This has been confirmed (mostly due to work-from-home), and also led to the supposition that household formation would slow sharply now (mostly confirmed) and that asking rents might decrease in 2023 on a year-over-year basis.
Here is a graph of the year-over-year (YoY) change for several rent measures since January 2015. Most of these measures are through June 2023, except CoreLogic is through May and Apartment List is through July 2023.
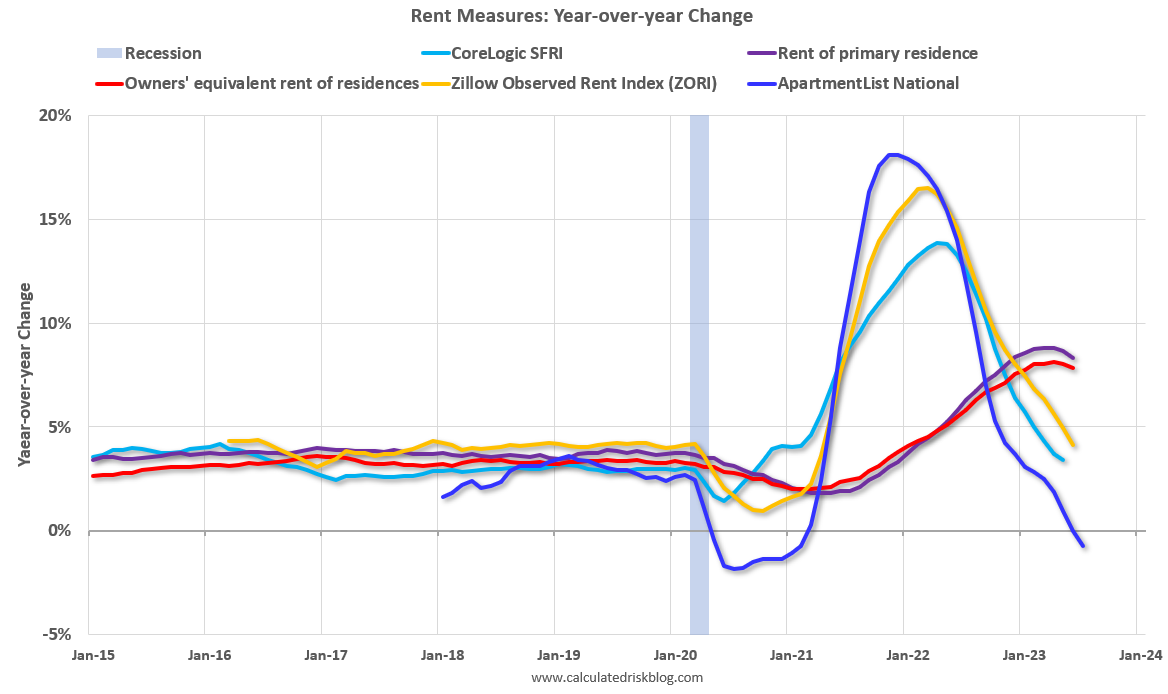
Asking rents are down YoY, and with new supply coming on the market, we will likely see further declines in asking rents.
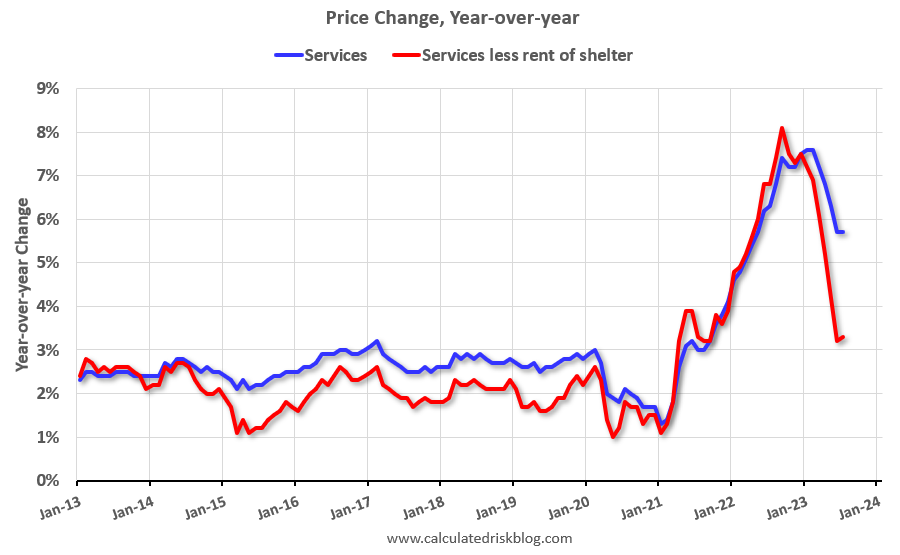
Last week, the BLS noted in the CPI report: “The index for shelter was by far the largest contributor to the monthly all items increase, accounting for over 90 percent of the increase, with the index for motor vehicle insurance also contributing.”.
This is important for housing and also for monetary policy. Fed Chair Powell mentioned he was watching services less rent of shelter earlier this year when this measure was up 7.6% year-over-year. This has fallen sharply and is now up 3.3% YoY.
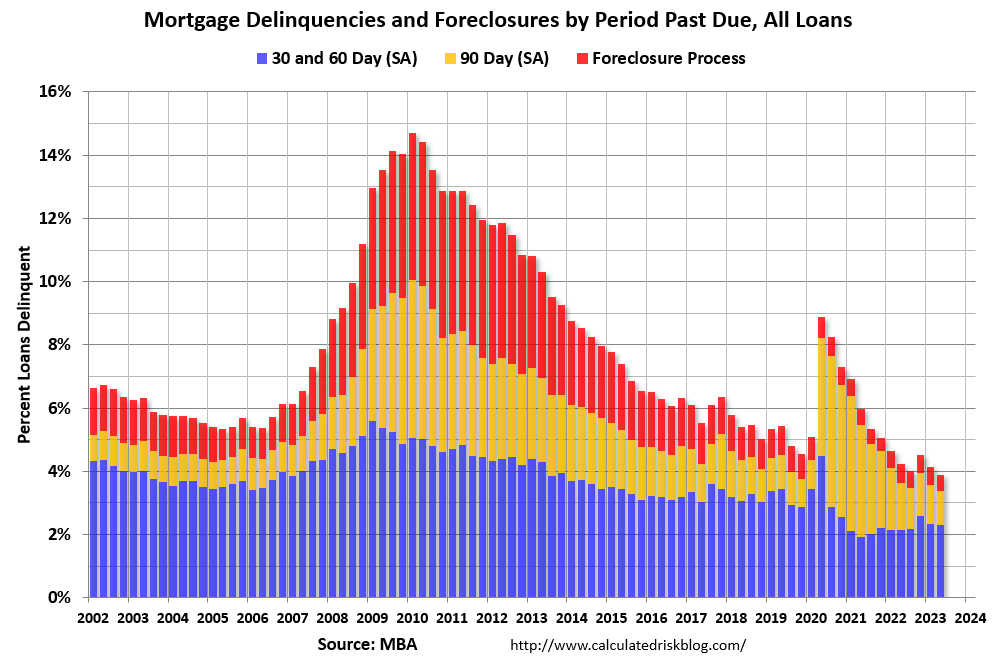
Mortgage Delinquencies Lowest on Record
Last week, the Mortgage Bankers Association (MBA) reported that mortgage delinquencies were at the lowest level on record.
“The seasonally-adjusted mortgage delinquency rate fell to its lowest level since MBA’s survey began in 1979, reaching 3.37 percent in the second quarter of 2023,” said Marina Walsh, CMB, MBA’s Vice President of Industry Analysis.
This graph shows the percent of loans delinquent by days past due. Overall delinquencies decreased in Q2.
I’ve argued that there would not be a huge wave of single-family foreclosures this cycle since lending standards have been solid and most homeowners have substantial equity. That means we will not see cascading price declines like following the housing bubble. This is a high confidence prediction and is supported by the following data.
The next graph shows Mortgage Originations by Credit Score from the NY Fed Q2 Quarterly Report on Household Debt and Credit since 2003. Unlike during the housing bubble, most recent borrowers had solid credit scores.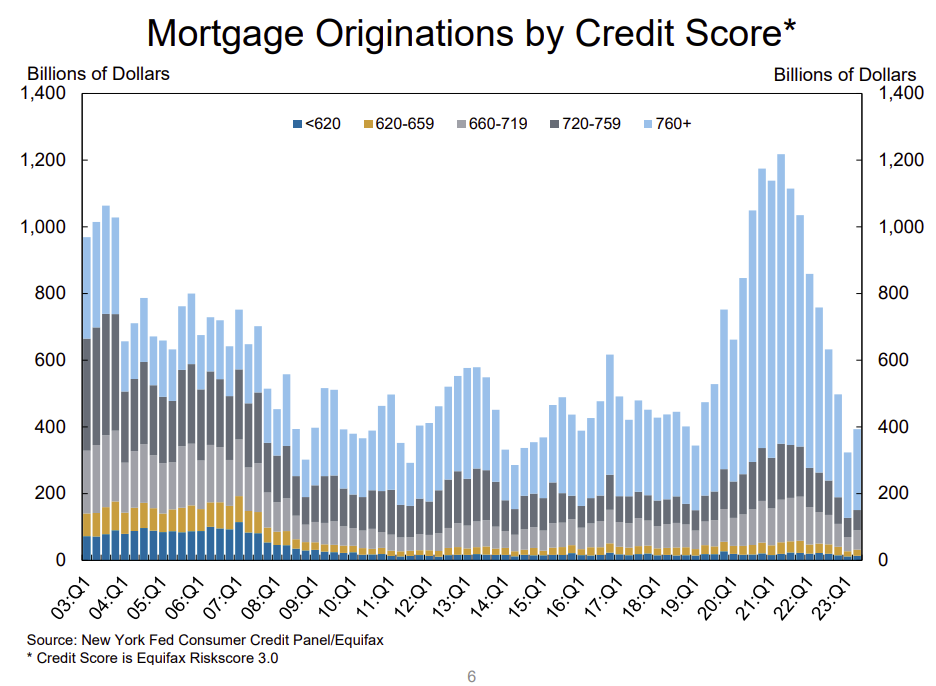
Conclusions
We have seen a significant year-over-year decline in new and existing home sales, although it is likely that new home sales activity has bottomed. With the recent increase in mortgage rates, we might see further declines in existing home sales.
House prices are under pressure due to higher mortgage rates, but prices are being supported by low levels of inventory. See: House Price Battle Royale: Low Inventory vs Affordability.
Existing home sales will likely be down less year-over-year NSA in July compared to June, however early local market data suggests sales seasonally adjusted will be close to the 4.16 million SAAR in June.
Multi-family housing starts will probably show fairly significant declines soon, since lending has tightened, and the Architectural Billings Index is indicating a slowdown in multi-family design.