

The Great Slowdown: The 10 U.S. Cities Where Home Sales Are Down the Most
By Evan Wyloge
If the housing market of just a year ago still seemed to be moving at quantum speed, today it’s more akin to an interminable traffic jam—with no exit ramps or HOV lanes in sight.
As higher mortgage rates have made buying a home ever more expensive, the pool of buyers who can afford to purchase real estate has dried up. Nationally, the number of existing-home sales plummeted 36% in November compared with a year earlier, according to a Realtor.com® analysis of CoreLogic data. (The data did not include sales of new-construction homes.) There were 395,000 sales in November 2021 compared with 251,000 one year later.
So home sales have declined by a third across the U.S. But where are they down the most? The data team at Realtor.com found the parts of the country with the steepest declines in transactions.
These were often the COVID-19 pandemic hot spots, particularly in the Sun Belt stretching from California to Florida where buyers flocked to over the Past few years and bid up prices to unthinkable heights. Newtonian laws of real estate ultimately prevailed: Markets that went way up ultimately fell back down to earth, hard.
Mortgage rates peaked at over 7% in late October and November—more than double what they were just a year earlier. Remarkably, that made the average monthly payment about 75% more expensive* than what it was a year ago. Buyers who needed a mortgage to purchase a home understandably balked, and sales dried up.
“This shows how sensitive buyers are to mortgage rates,” says Selma Hepp, chief economist for CoreLogic.
These drop-offs have followed in the wake of the homebuying frenzy that took place during the pandemic. The unique market conditions during that period—mortgage rates at record lows, people rushing to find larger abodes, pent-up demand, and an unprecedented number of workers with the ability to work from anywhere—created a huge surge in the housing market. More than 6 million homes were sold in 2021, the most since the run-up to the Great Recession.
“Everything is thrown out of whack because of the pandemic,” Hepp says, adding that data still being collected for transactions after November shows some signs of stabilization. “The rate of decline is shrinking, so I think we’re getting near a ‘bottom-out’ or at least an inflection point.”
Home prices have come down a little in some parts of the country, but they’re expected to remain high as there still aren’t enough homes for sale in much of the nation. The market has begun to bounce back, but the recent rise in mortgage rates could plunge it back into a freeze.
“It’s very uncertain right now,” says Hepp.
The list of metropolitan areas where existing-home resale transactions have declined the most was derived from CoreLogic sales data, comparing November 2022 with November 2021. Only one metro per state was included to ensure geographic diversity, and new construction was not tracked. (Metros include the main city and surrounding towns, suburbs, and smaller urban areas.)
Los Angeles was excluded from the ranking due to data issues.
So where are home sales down the most?
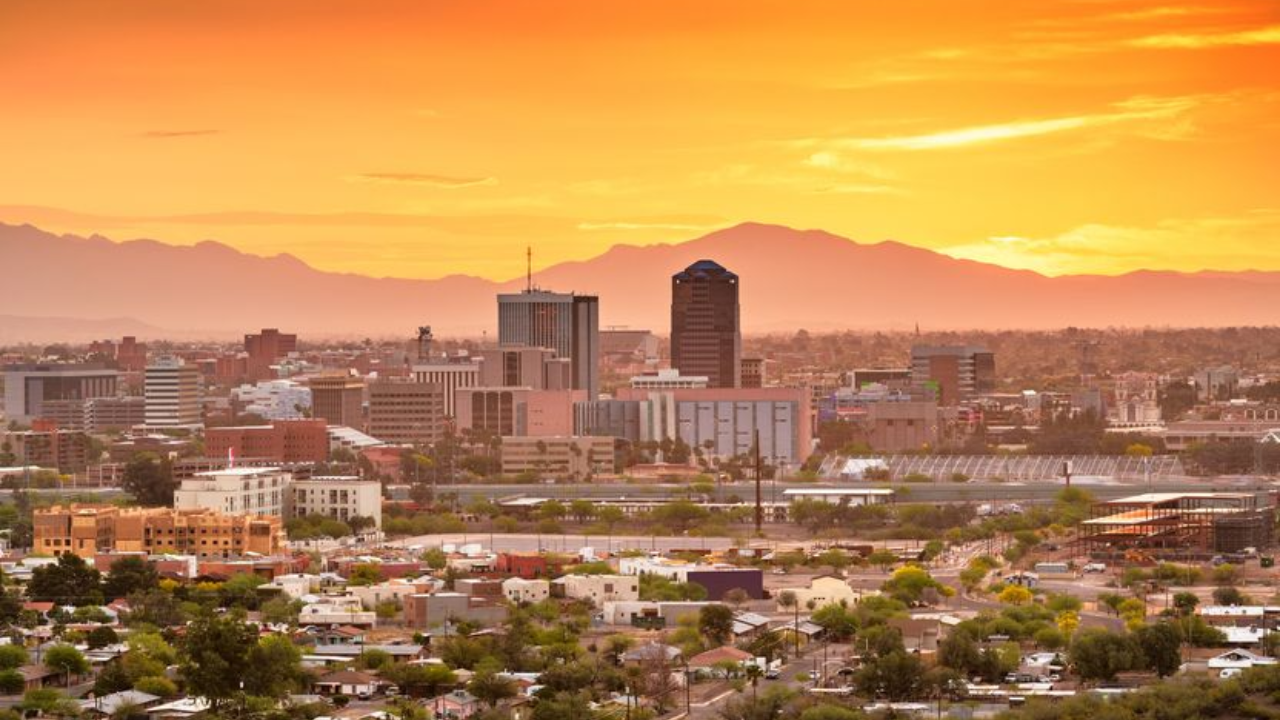
1. Tucson, AZ
November 2021 sales: 2,248
November 2022 sales: 789
Year-over-year change: -64.9%
The biggest year-over-year decline is in Tucson, the second-largest metro in Arizona, about 90 minutes south of Phoenix. It’s a Sun Belt city that’s popular with buyers as it’s not as hot or as expensive as Phoenix .
The large year-over-year decline in November comes as the market went from a historic high point to a period of dramatic slowdown, says John Mijac, the managing broker at Long Realty Foothills in Tucson.
“These last three years are statistical outliers,” he says.
Mijac says he’s optimistic about the Tucson market. In the past few weeks, he’s seen an uptick in sales.
“There’s still some latent demand,” he says. “Listings priced right sell quickly, sometimes even with multiple offers.”
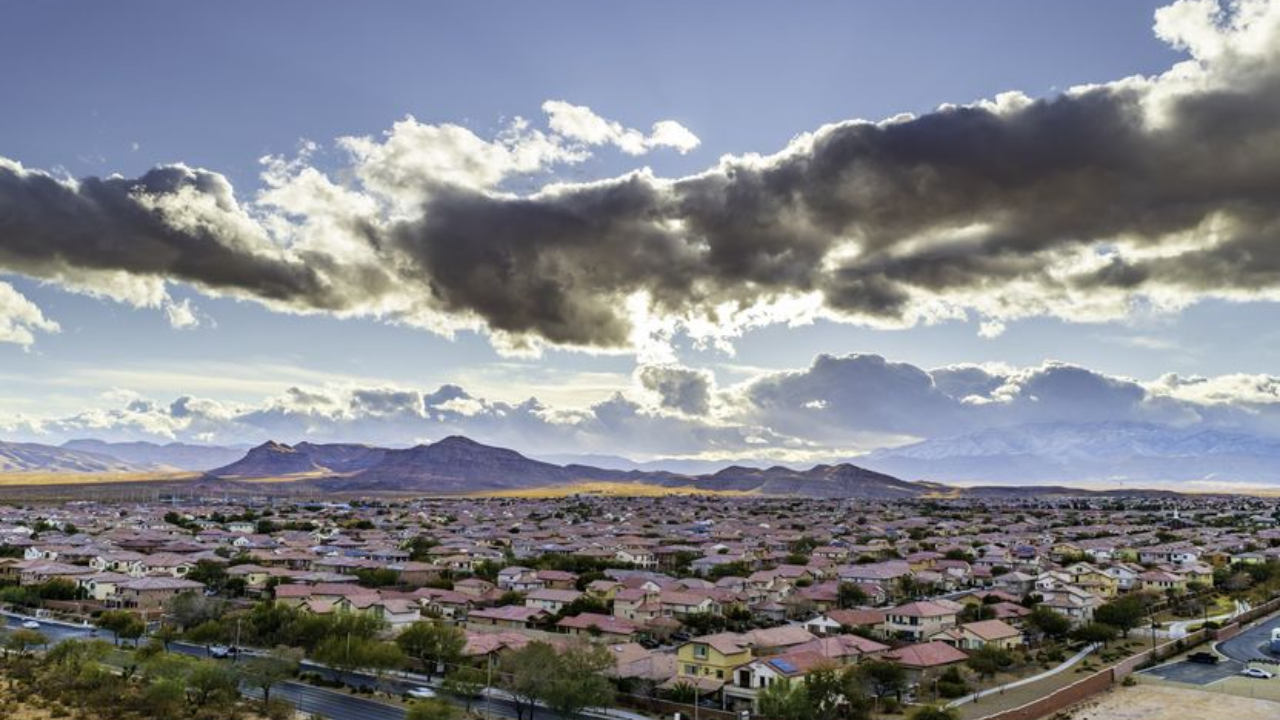
2. Las Vegas, NV
November 2021 sales: 4,058
November 2022 sales: 1,615
Year-over-year change: -60.2%
Las Vegas has long been known as a boom or bust market, where the number of home sales cratered during the Great Recession.
“We’ve had ups and downs, buyer’s markets, seller’s markets,” says Bryan Kyle, a real estate agent and property manager at First Serve Realty in Las Vegas. “But in all my years of doing this, I haven’t seen a U-turn quite like this. We’re shaking the trees really hard, to try to find transactions right now.”
However, the number of homes for sale is still very low.
“Somehow, it actually shrank in January,” he says.
Kyle says he’s not totally pessimistic, and he also sees demand for housing, but the affordability problem is keeping buyers from closing.
“They’re all sitting on the sidelines waiting,” he says.
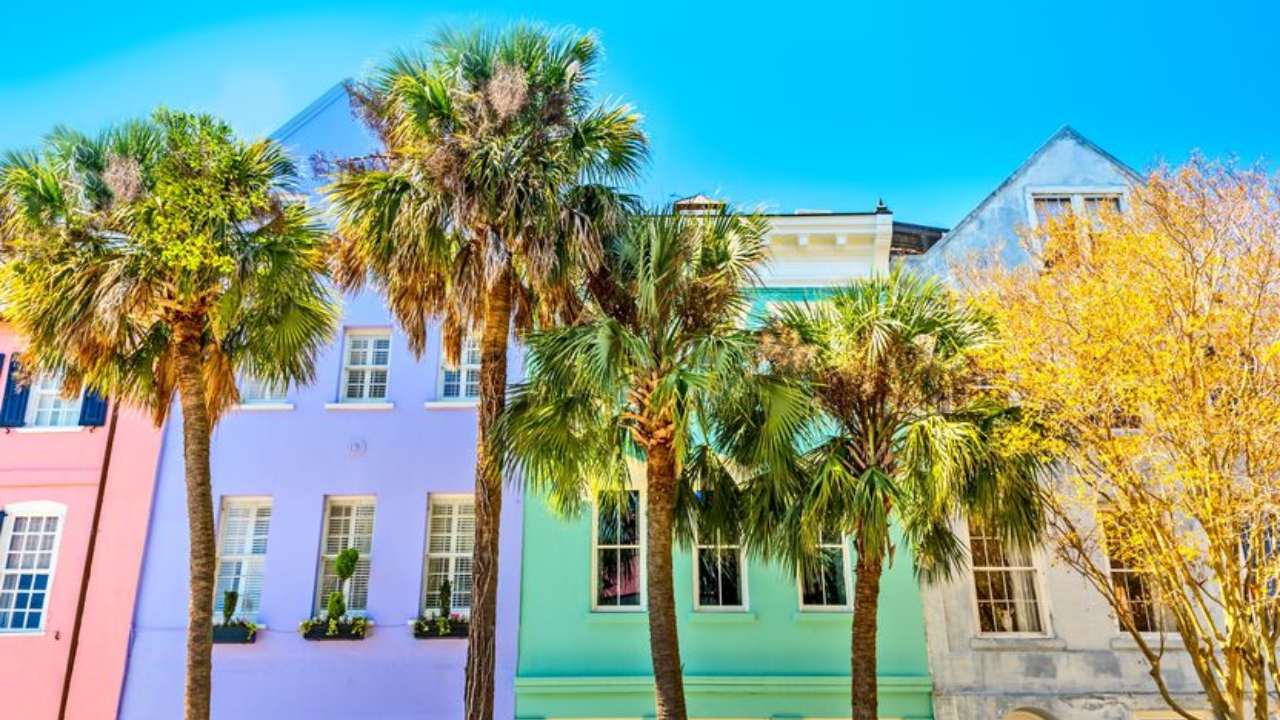
3. Charleston, SC
November 2021 sales: 1,513
November 2022 sales:633
Year-over-year change: -58.2%
Charleston was another metro that drew lots of new buyers during the pandemic. They were drawn to the mild climate, beaches, and more affordable housing prices. The bustling nightlife, dining, and shopping options also helped to give the city a boost. However, that surge in demand drove prices up quickly.
Prices were up 21.5% from November 2019 to November 2021, hitting $399,000, according to Realtor.com data.
“A lot of places where home prices accelerated faster than the rest of the country, that’s where we’re seeing a larger decline in sales,” notes Hepp.
4. Ventura, CA
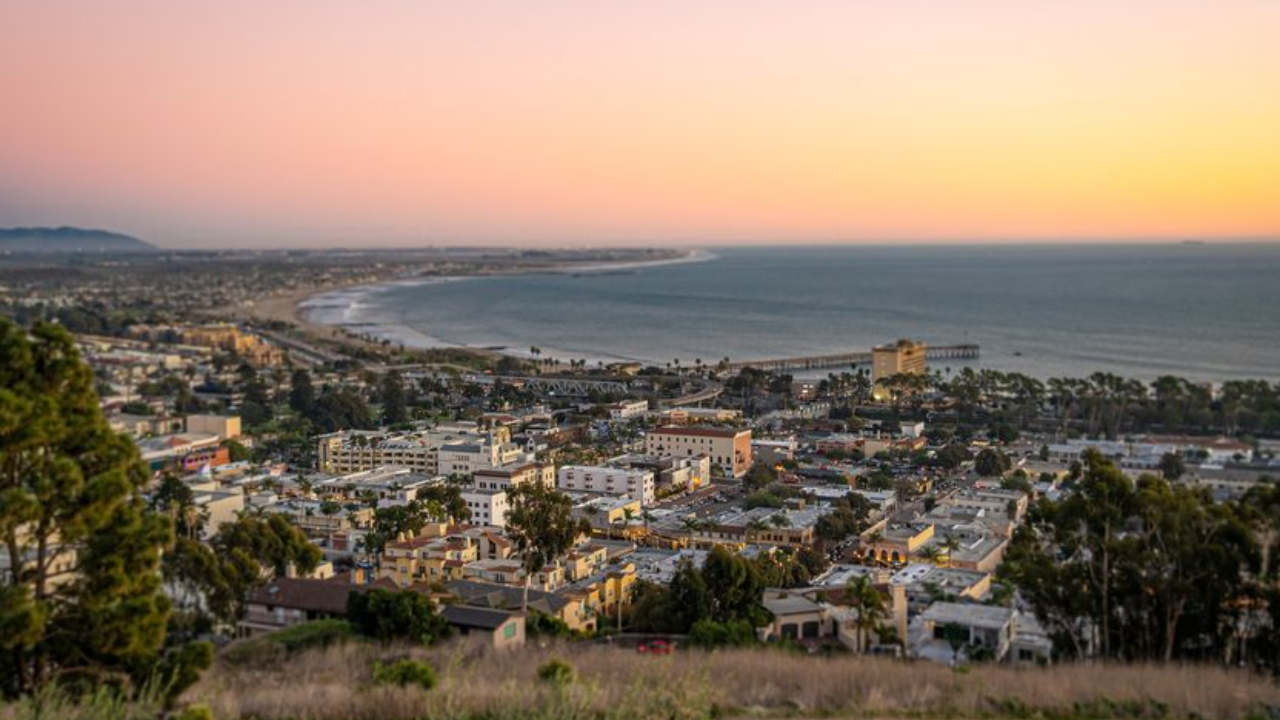
November 2021 sales: 685
November 2022 sales:321
Year-over-year change: -53.1%
California’s coastal cities have seen a quick turnaround in housing market activity. From San Diego to San Francisco, high-priced real estate has seen a sharp slowdown as buyers can’t afford them.
The median sales price in the Ventura metropolitan area, which includes Oxnard, was $875,000 in November, more than double the median national price tag of $415,750.
“The West Coast has an affordability problem and an inventory problem,” Hepp says.
That combination explains the rapid slowdown in places like Ventura, with interest rates elevating monthly purchase costs on top of the underlying dynamics of the market.
Keep up with key real estate trends
Sign up now
5. Salt Lake City, UT
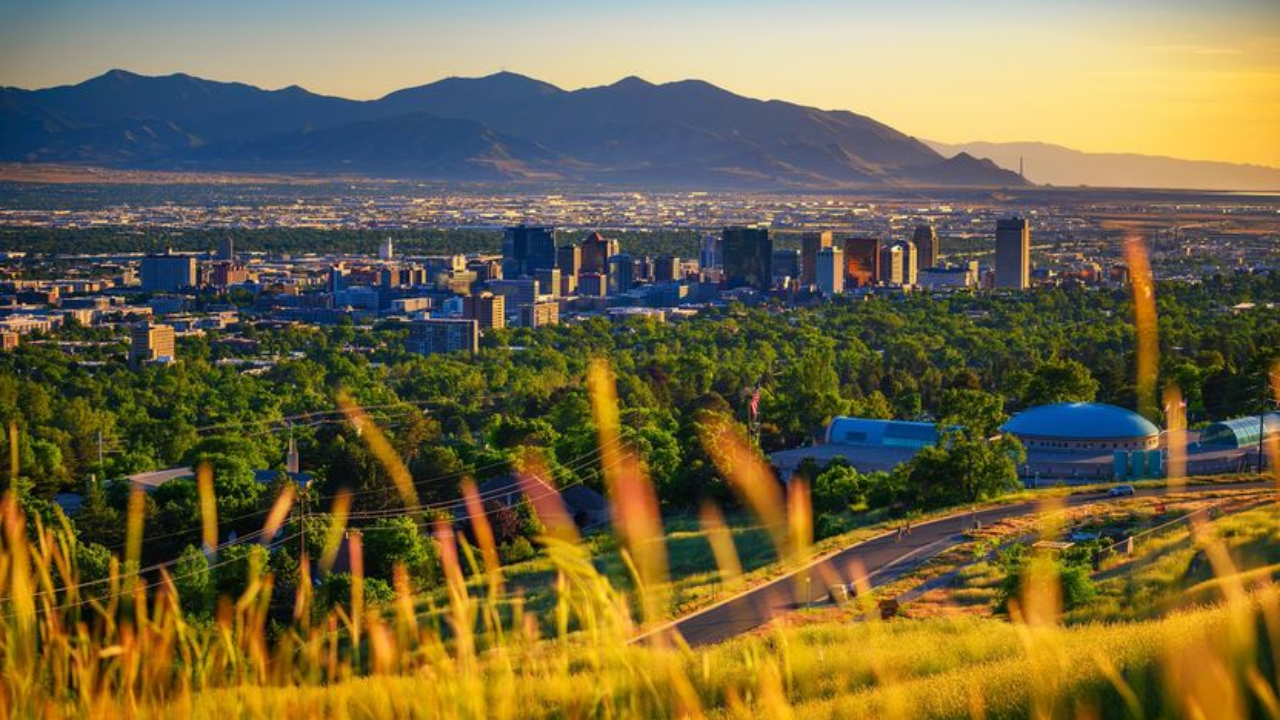
November 2021 sales: 1,506
November 2022 sales: 708
Year-over-year change: -53.0%
Salt Lake City was another pandemic hot spot, with a mild climate and a strong job market with lots of tech companies moving in. There’s also tons of outdoor recreation, from skiing or snowboarding in the winter, to mountain biking, hiking, and rock climbing in the warmer months.
However, fewer out-of-state buyers are now moving to the “Silicon Slopes” area and many locals simply can’t afford to buy real estate with higher mortgage rates. The median home list price in November was also higher than the national average at about $550,000, according to Realtor.com data. Now home sales are less than half what they were during the area’s recent peak.
6. Jacksonville, FL
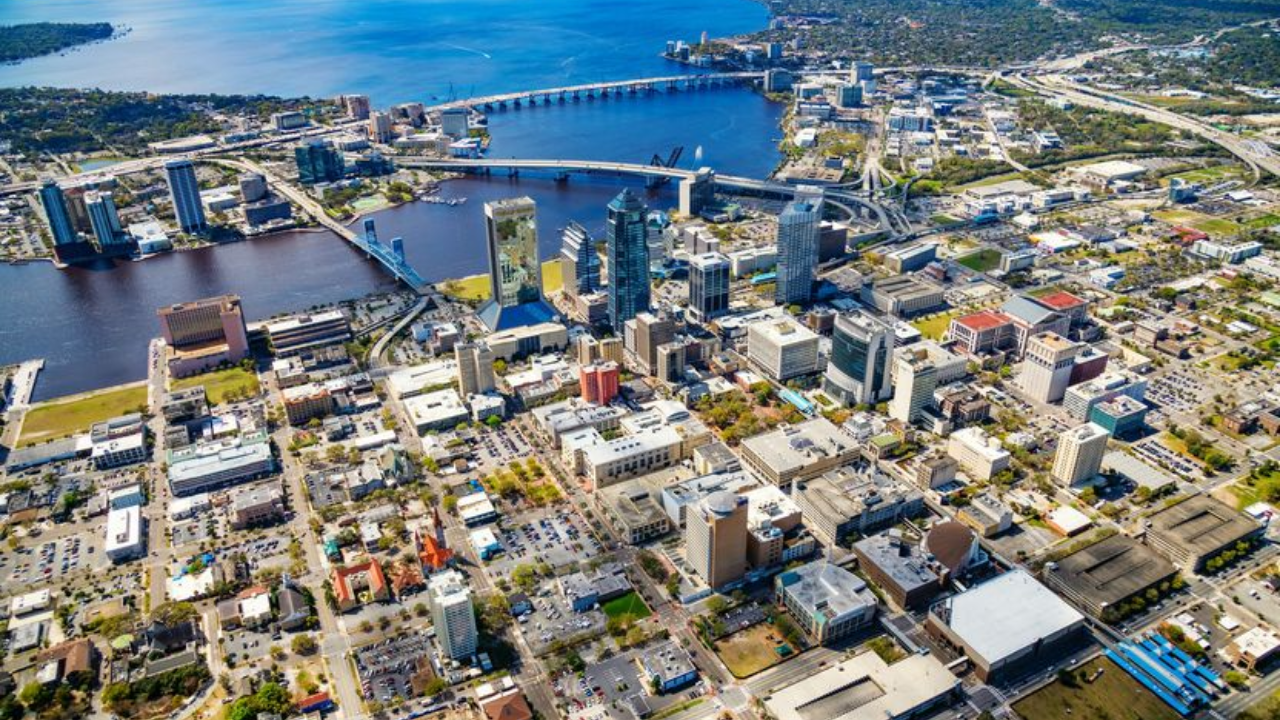
November 2021 sales: 3,528
November 2022 sales: 1,687
Year-over-year change: -52.2%
Perched on Florida’s northeastern corner, Jacksonville attracted lots of new residents seeking sun, sand, and more affordable real estate. The state’s relatively low cost of living and no income tax added to its popularity, and buyers and residents descended in droves. That has since ended.
“The market is off,” says Elysia Stobbe, a mortgage lender at NFM Lending in Jacksonville.
But she’s optimistic, and like others, says she thinks November might have been the low-tide mark.
“The three-month trend is looking good,” Stobbe says of what she’s seen since then.
7. Colorado Springs, CO
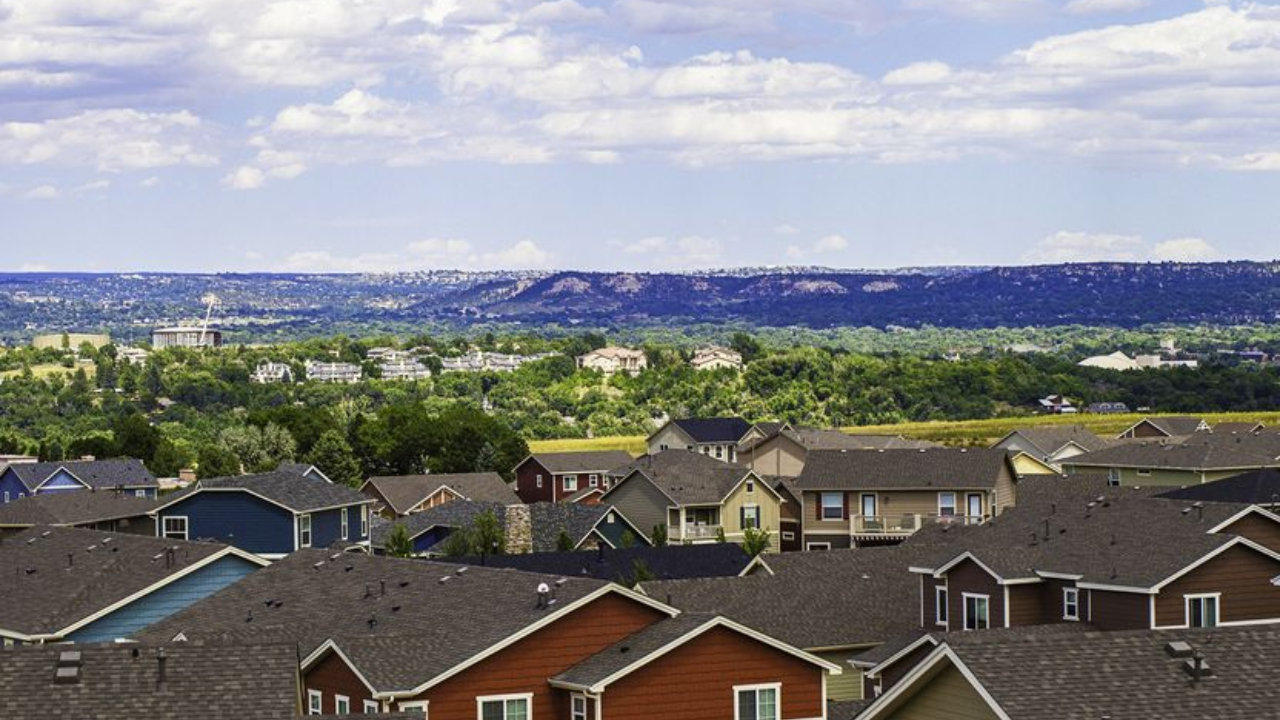
November 2021 sales: 1,599
November 2022 sales: 827
Year-over-year change: -48.3%
About an hour south of Denver, situated at the foot of the Colorado Rockies, Colorado Springs offers access to snow sports in the winter and hiking and biking in the summer.
The area has had a well-anchored economy for years, in large part due to a heavy military presence. The area is home to many of the military staff and contractors who work at Fort Carson, Schriever Space Force Base, Peterson Air Force Base, the U.S. Air Force Academy, and the Cheyenne Mountain facility, all nearby.
But soaring demand during the pandemic drove real estate prices to new highs in Colorado Springs. Priced-out buyers have since backed off, leading to the drop in sales.
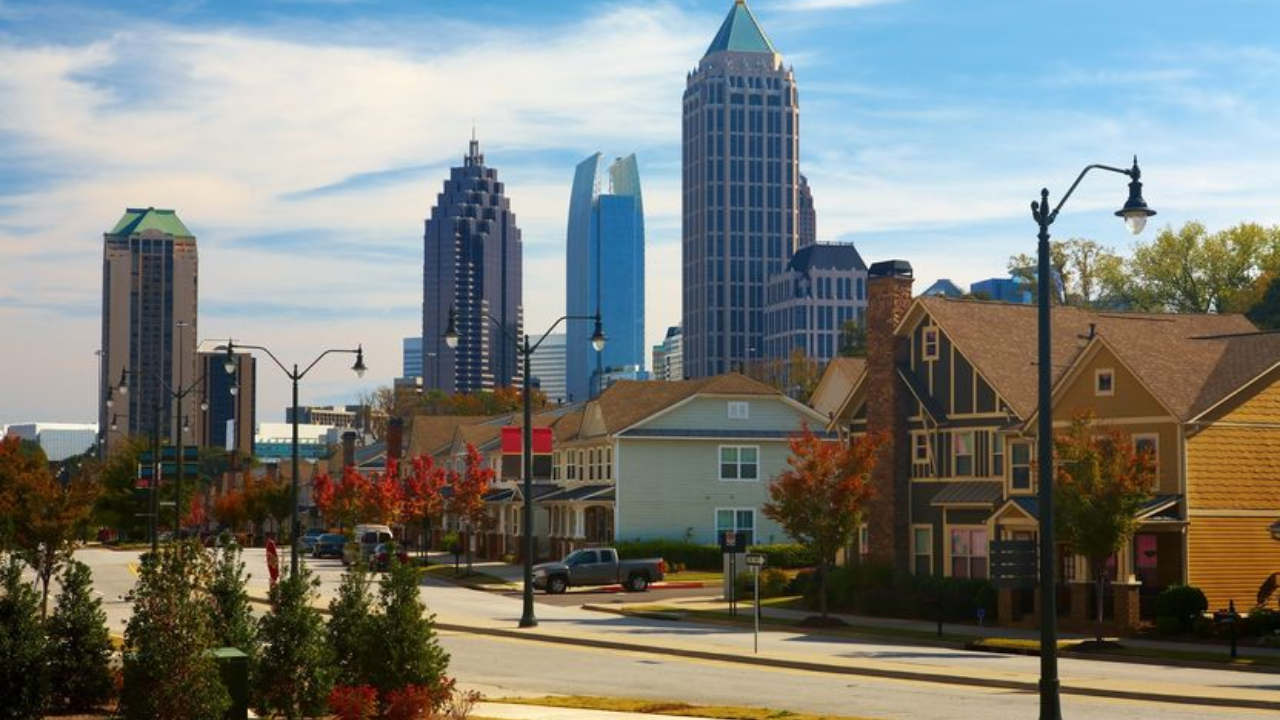
8. Atlanta, GA
November 2021 sales: 11,293
November 2022 sales: 5,932
Year-over-year change: -47.5%
Atlanta, an economic capital of the South, has been attracting new residents and lots of cultural attention, with the eponymous Donald Glover–led TV show and even “The Walking Dead” shining a spotlight on the area.
The economy has been strong in Atlanta for years, with steady population growth and an influx of new companies. State Farm Insurance and Mercedes-Benz moved their headquarters there, and Microsoft, Amazon, and Google all expanded into the city.
While the list is ranked by the percentage change, since this is the largest metro on the list, it saw the largest decrease in sales. In November 2022, there were 5,400 fewer sales than one year before—more than twice the number of any other metro on the list—as buyers were priced out of homeownership.
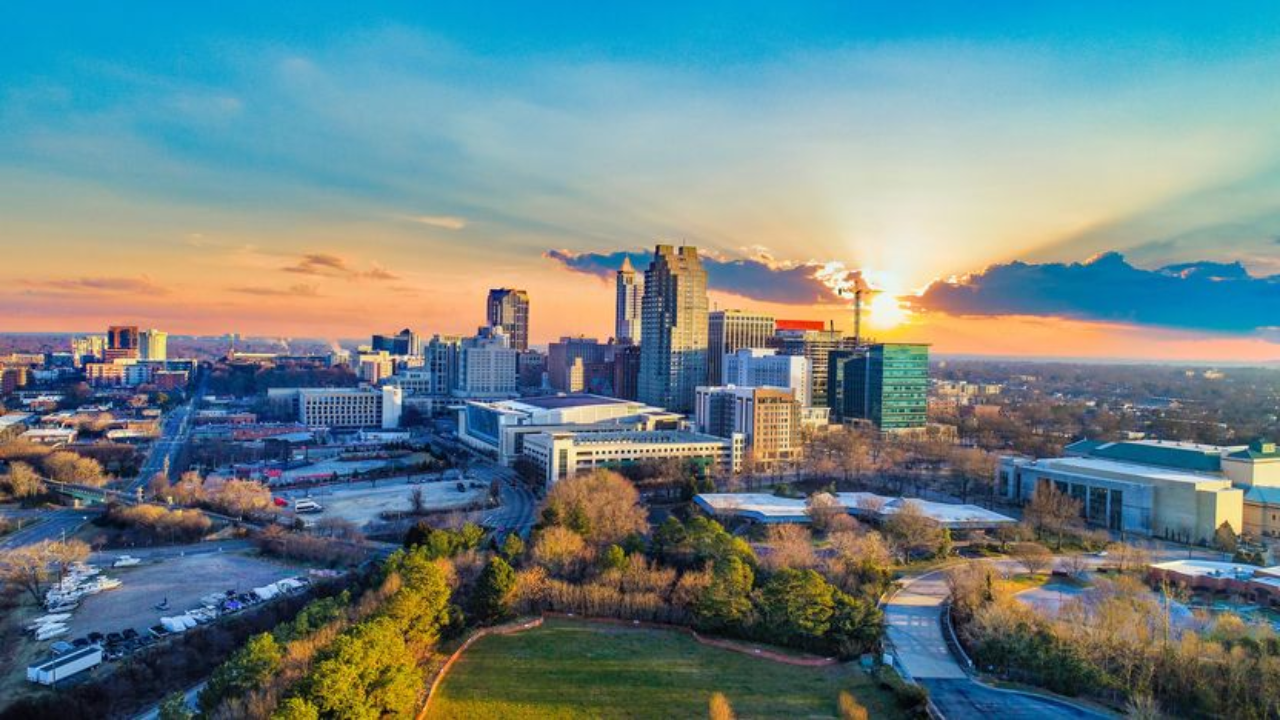
9. Raleigh, NC
November 2021 sales: 2,419
November 2022 sales: 1,281
Year-over-year change: -47.0%
North Carolina—particularly the research triangle comprising Raleigh, Durham, and Chapel Hill—has enjoyed a yearslong influx of newcomers.
The area is known for more than its natural beauty. It’s also renowned as a center for education, with premier schools such as Duke University, and as a tech hub, with Cisco, Lenovo, IBM, and plenty of smaller startups.
The high demand in the area accelerated in 2020, with Raleigh drawing new residents from more expensive cities along the East Coast. However, that’s faltered in recent months as buyers have been struggling with affordability.
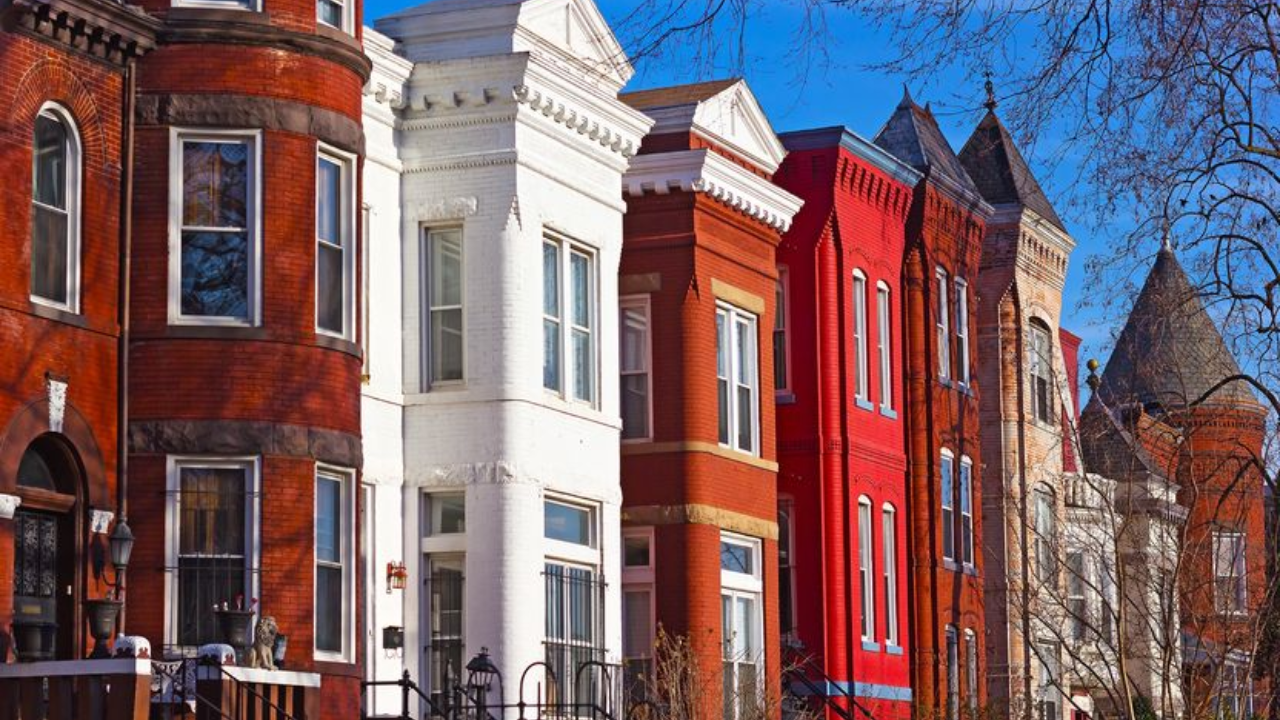
10. Washington, DC
November 2021 sales: 5,305
November 2022 sales: 2,877
Year-over-year change: -45.8%
The nation’s capital has some of the most expensive real estate in the country, following a decade of population growth.
That has led to lots of new real estate development, though most of it has been in the form of luxury apartments and retail, pushing prices up—too high, in fact, for many buyers in an era of mortgage rate increases.
For the median home price in Washington, DC, the monthly payment would be well over $1,000 higher than just one year earlier.
* The calculation factors in Realtor.com median list prices nationally in November 2022 compared with November 2021 and uses average weekly mortgage rates from Freddie Mac. It assumes buyers put down 20% and does not include taxes, homeowners association dues, and insurance costs.