

Home prices spiral upward, worsening affordability
By Dave Gallagher | Real Estate News
A collection of reports show that high mortgage rates weren’t enough to dampen price increases as demand continues to outpace supply.
Key points:
- Case-Shiller, FHFA and Redfin indexes reported higher home prices in September and into October.
- Combined with elevated mortgage rates, affordability is hitting record lows.
- This highlights a widening gap between the “haves” and the “have nots,” says Bright MLS Chief Economist Lisa Sturtevant.
Even as mortgage interest rates were spiking earlier this fall, home prices continued climbing through the end of September and into October, according to data from three new reports.
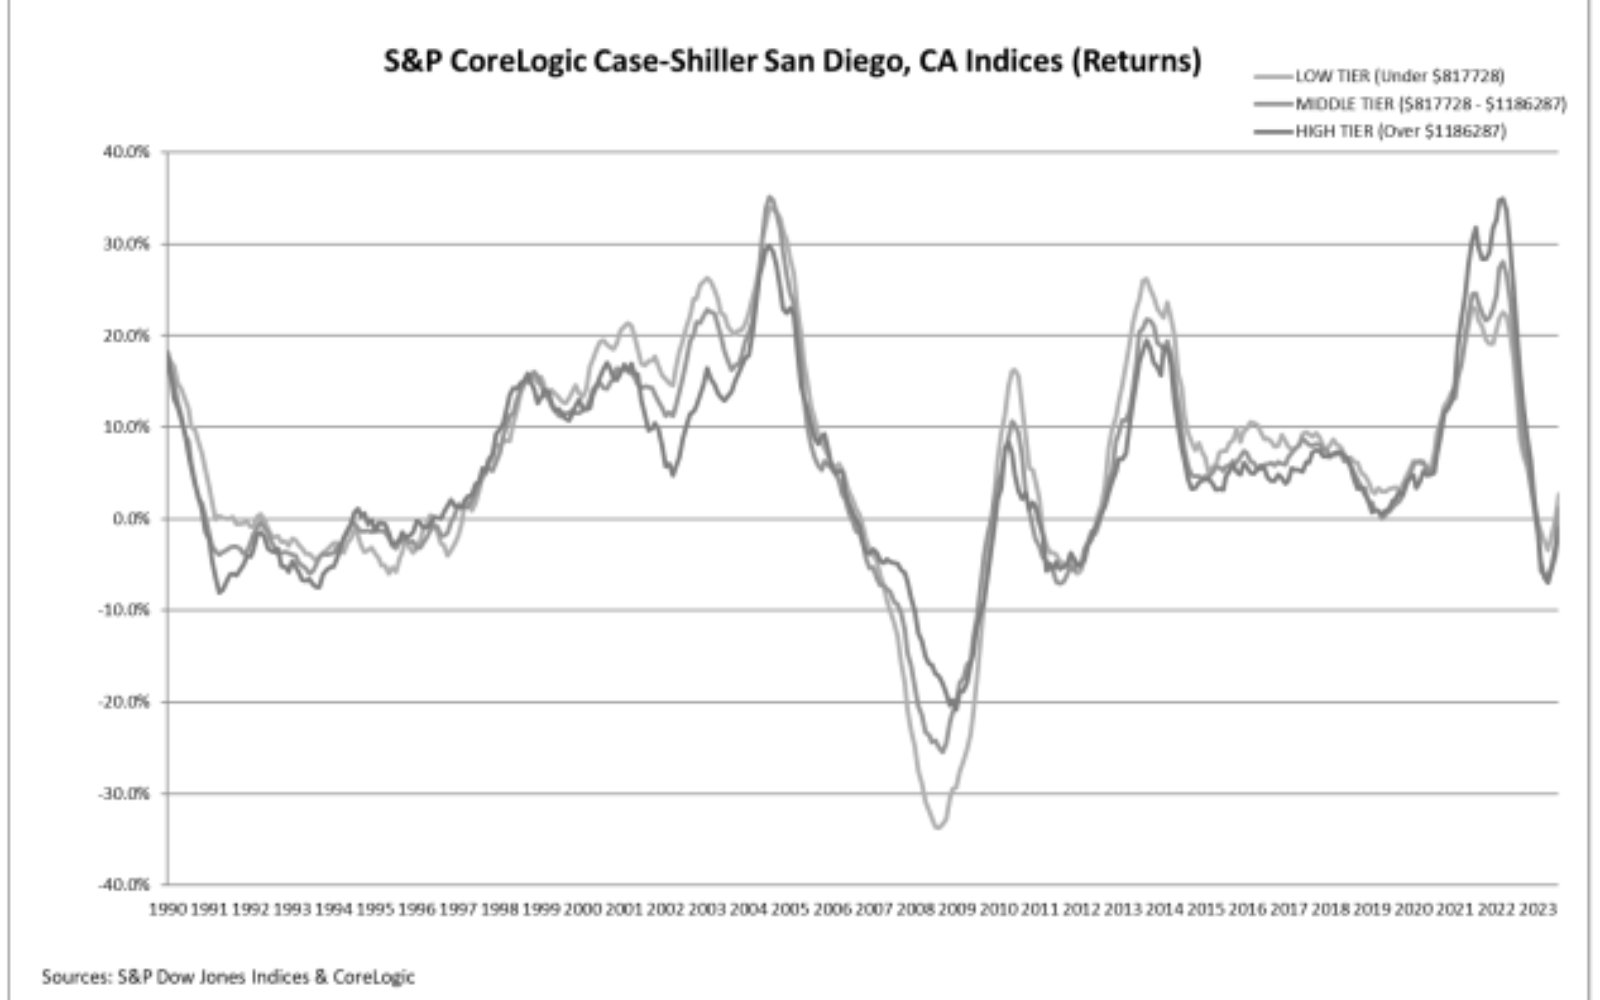
The S&P CoreLogic Case-Shiller index found that national home prices rose 3.9% compared to a year ago — the highest year-over-year jump since September 2022. The index was also up 6.6% compared to the beginning of the year.
The Federal Housing Finance Agency, which uses loan purchasing data from Fannie Mae and Freddie Mac, reported that its House Price Index rose 5.5% year-over-year during the third quarter.
And Redfin’s newly released Home Price Index found that prices didn’t slow down in October either, even as mortgage rates hit 8%. The Redfin report, which uses a repeat-sales method similar to Case-Shiller, showed prices rising another 1% between September and October.
All three reports point to the same persistent issue: Inventory is not keeping up with demand, leaving many potential homebuyers on the sidelines because costs are too high.
“Speeding up of annual home price growth reflects much of the pent-up demand that exists in the housing market amid very low inventories,” said Dr. Selma Hepp, chief economist at CoreLogic.
The Atlanta Federal Reserve’s Home Ownership Affordability Monitor, which measures a median-income household’s ability to manage the cost of owning a median-priced home, was at 67.1 in September — well below the affordability threshold of 100, and down 2.3% year-over-year.
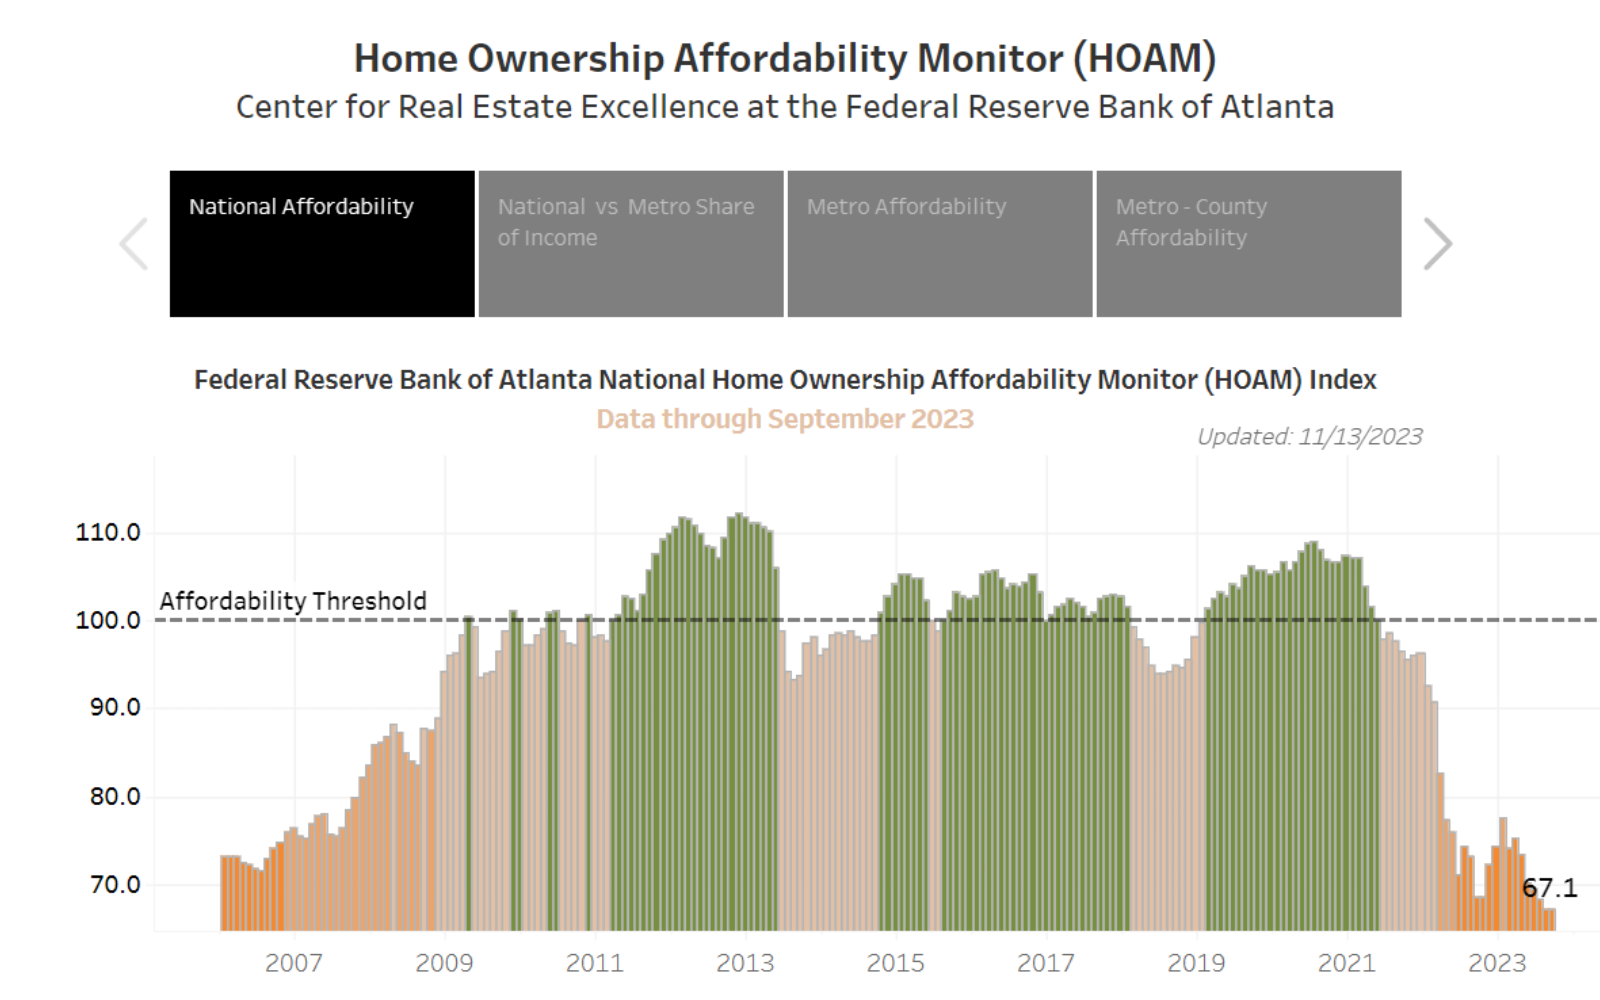
The September score was the lowest level for the index in at least 17 years, and the affordability monitor has not reached 100 since May 2021.
Cash remains king
Buyers who purchased a home this fall were more likely to pay all cash or supply a bigger down payment to offset some of the costs of a high-interest loan, said Lisa Sturtevant, chief economist at Bright MLS.
“However, more cash buyers in the market also signals the widening gap between the ‘haves’ and the ‘have nots,'” Sturtevant said. “Existing homeowners have accumulated record levels of equity and are able to roll that equity into the purchase of a new home. Prospective buyers who are still on the sidelines are finding it increasingly hard to compete.”
Metro and regional price changes
Detroit (+6.7%), San Diego (+6.5%) and New York (+6.3%) were the top three metro-area markets in terms of price increases, according to the Case-Shiller Index. Las Vegas (-1.9%), Phoenix (-1.2%) and Portland, Oregon (-0.7%) were at the bottom of the major metro list.
At the state level, the FHFA found that the Northeast had the strongest home appreciation jumps, led by Vermont (up 11.8% year over year), Maine (up 11.1%) and New Hampshire (up 10.3%). The two areas that experienced depreciation in the past year were Washington D.C. (down 0.8%) and Hawaii (down 0.9%).
In the Redfin report, which includes additional metro areas, Pittsburgh had the biggest one-month increase in home appreciation, rising 1.8% between September and October. Austin had the biggest monthly decline, dropping 1.5%.